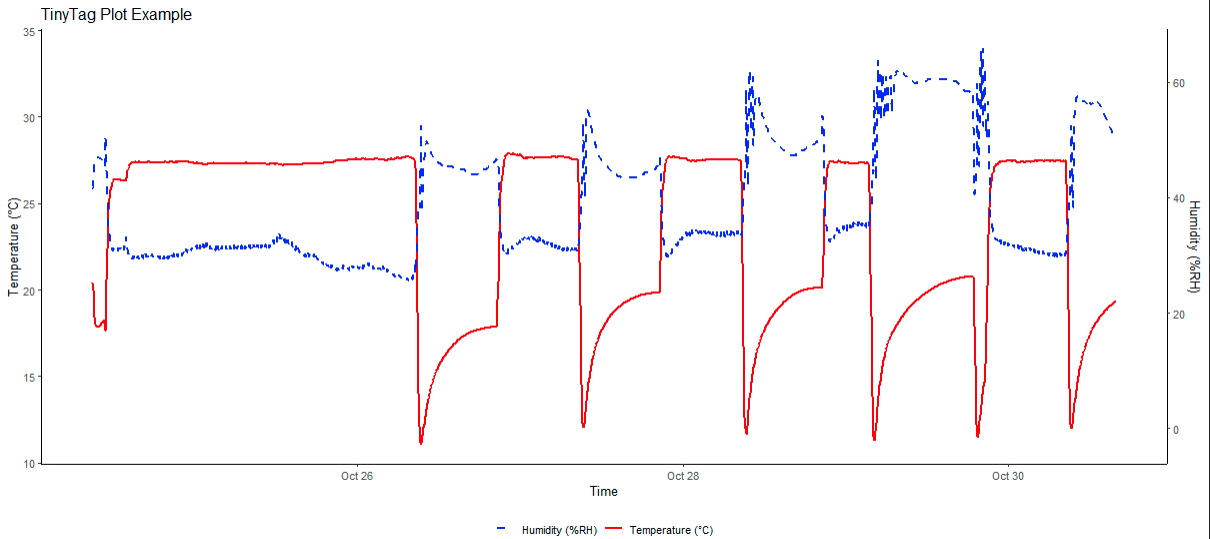
Using tinyTag_plot()
Data recorded with Gemini TinyTag loggers can be
downloaded using the TinyTag Explorer software. The
tinyTag_plot() function in seedTools
provides a simple way to clean the exported .csv file and
generate a dual-axis plot showing recorded temperature
and humidity over time.
To use this function, supply the path to the .csv file
and, optionally, a custom title for the plot. For example:
tinyTag_plot("example_file.csv", title = "TinyTag Plot Example")