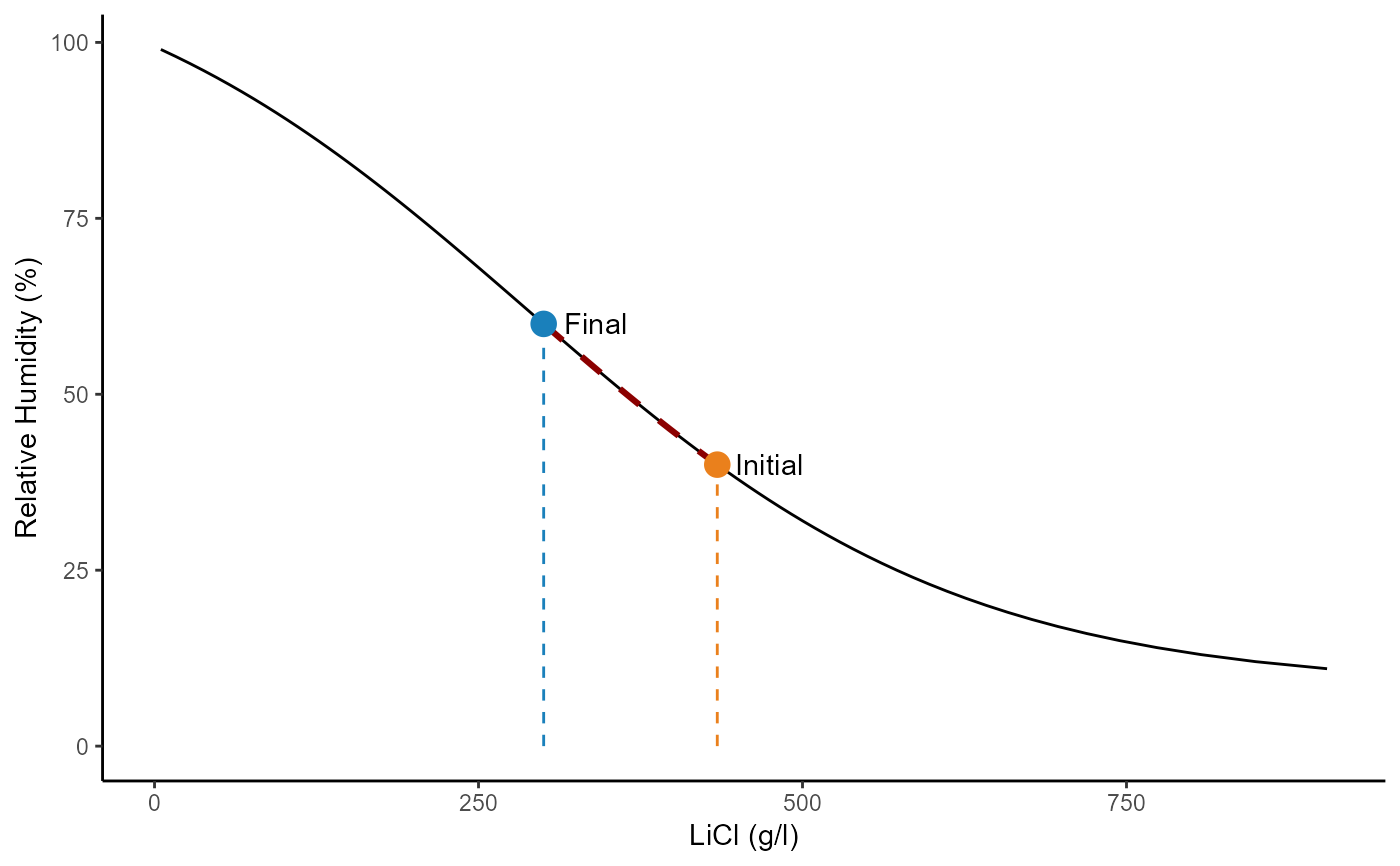
Plots a basic graph showing desired changes in LiCl solution
Source:R/plot_rh_modify.R
plot_rh_modify.RdPlots a basic graph showing desired changes in LiCl solution
R/plot_rh_modify.R
plot_rh_modify.RdPlots a basic graph showing desired changes in LiCl solution