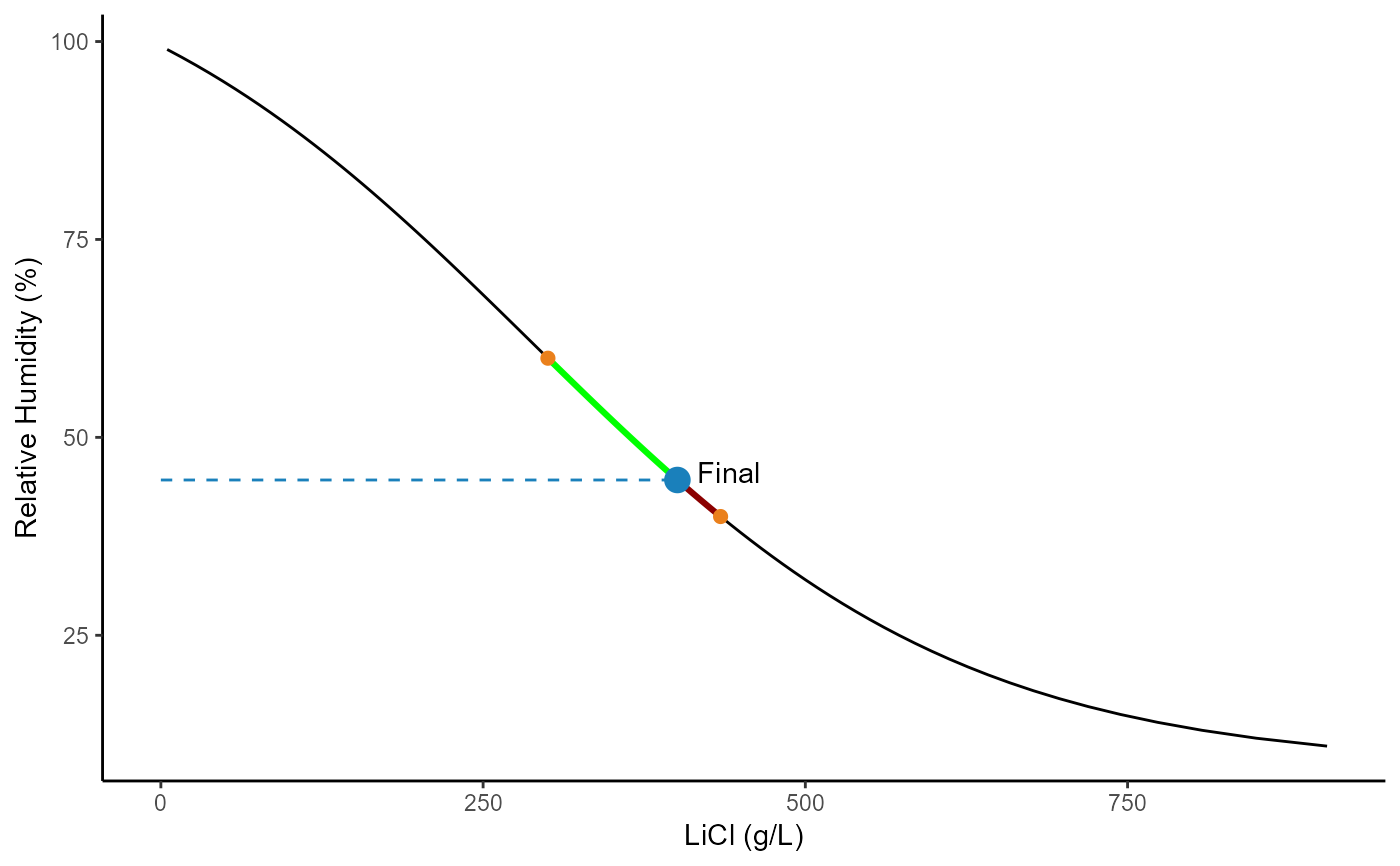
Plots a basic graph showing LiCl after mixing two solutions
Arguments
- rh1
The relative humidity percentage value of solution number one
- vol1
The volume 'in Litres' of solution rh1
- rh2
The relative humidity percentage value of solution number two
- vol2
The volume 'in Litres' of solution rh2#'
- theme
chose between light and dark plot background
- units
select LiCl concentration to be "g/L" or "g/100ml)